This subchapter is provided as a free sample for Swift Charts Beyond the Basics book.
You can read it online or download the sample bundle with PDF and EPUB by clicking the link below.
Download free sampleTo get access to the contents of the whole book you need to purchase a copy.
FREE SAMPLE - online version
Calendar layouts
Calendar layouts arrange observations by deriving two positions from their temporal values. One axis can retain an observation's place in a larger calendar sequence, while the other maps a recurring component, such as its time of day or weekday, onto a shared reference period.
These derived dates make recurring intervals and calendar components directly comparable, but they don't replace the source dates that give the observations their meaning. We therefore need to preserve the original dates, durations, and calendar relationships when describing the chart's values.
# Recurring time ranges
A temporal interval can be located both by the calendar period it belongs to and by the part of a recurring cycle that it occupies. We can encode the period on one axis and the interval on the other. The second axis uses a shared reference date so that equivalent times occupy the same positions across observations.
After reconstructing each start time on the reference date, we derive its end by adding the interval's original duration. This keeps an interval that crosses the cycle boundary continuous instead of placing its end before its start.
Consider a collection of sleep sessions. Each session belongs to a particular night and spans an interval within the daily cycle. Plotting the night horizontally and the normalized time range vertically lets us compare changes in both the beginning and end of each session without reducing the interval to a total duration.

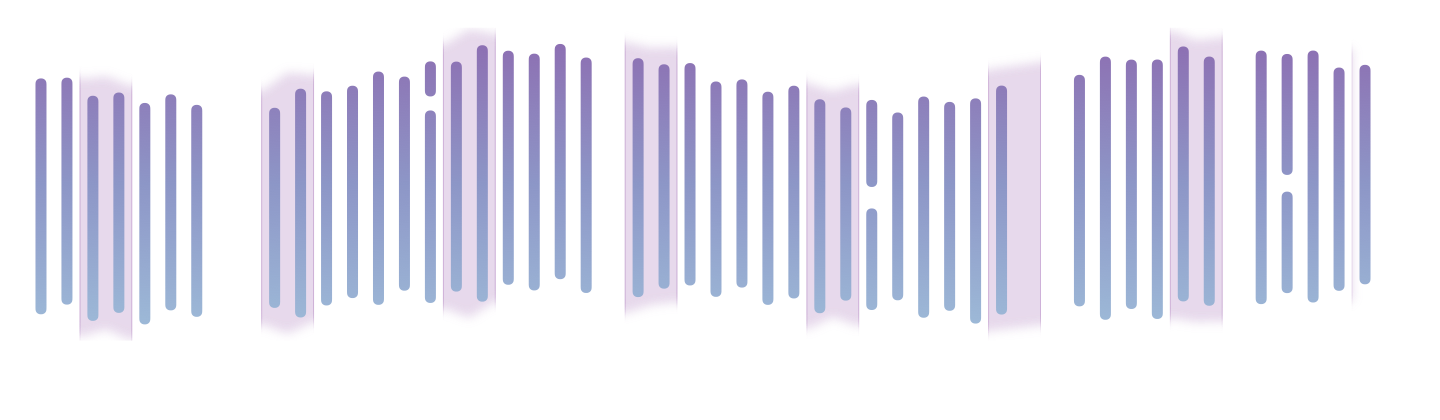
Each vertical bar extends from the time when a session began to the time when it ended. Because every session uses the same vertical reference period, we can compare changes in its start and end times, while the length of the bar continues to represent its duration.
We first need to decide which night each session belongs to. Using midday as the boundary between consecutive nights, we can subtract twelve hours from the start time:
let sleepDay = calendar.date(
    byAdding: .hour, value: -12, to: sleep.startDate
)!
The chart groups sleepDay by its calendar day. A session beginning before noon moves into the preceding day, while a session beginning after noon remains in its current day. This keeps periods of sleep separated by a brief awakening after midnight within the same night.
The vertical positions need a different form of normalization. We reconstruct the session's start time on a shared reference day, then add its original duration to obtain the end:
let startComponents = calendar.dateComponents(
    [.hour, .minute, .second],
    from: sleep.startDate
)

let referenceDate = calendar.startOfDay(for: Date())
let normalizedStart = calendar.date(
    bySettingHour: startComponents.hour!,
    minute: startComponents.minute!,
    second: startComponents.second!,
    of: referenceDate
)!

let normalizedEnd = normalizedStart.addingTimeInterval(
    sleep.endDate.timeIntervalSince(sleep.startDate)
)
Every session now begins within the same reference day. When a session continues across midnight, normalizedEnd falls on the following day, preserving the continuous interval instead of wrapping its end back to the beginning of the reference day.
The assigned night and normalized endpoints provide the positions for the range bar:
BarMark(
    x: .value("Day", sleepDay, unit: .day, calendar: calendar),
    yStart: .value("Sleep start time", normalizedStart),
    yEnd: .value("Sleep end time", normalizedEnd)
)
The normalized dates are useful for layout, but their reference day is not part of the underlying observation. We can replace the bar's automatic accessibility description with the original temporal meaning:
.accessibilityLabel(
    Text("Sleep on \(sleepDay, format: .dateTime.month().day())")
)
.accessibilityValue(
    Text(
        """
        \(sleep.startDate, format: .dateTime.hour().minute()) to \
        \(sleep.endDate, format: .dateTime.hour().minute())
        """
    )
)
The label identifies the night represented by the bar, while the value describes its original start and end times. The chart can therefore use normalized dates for comparison without presenting their shared reference day as part of the observation.
With several nights in the chart, the default vertical scale places earlier times toward the bottom and later times toward the top.

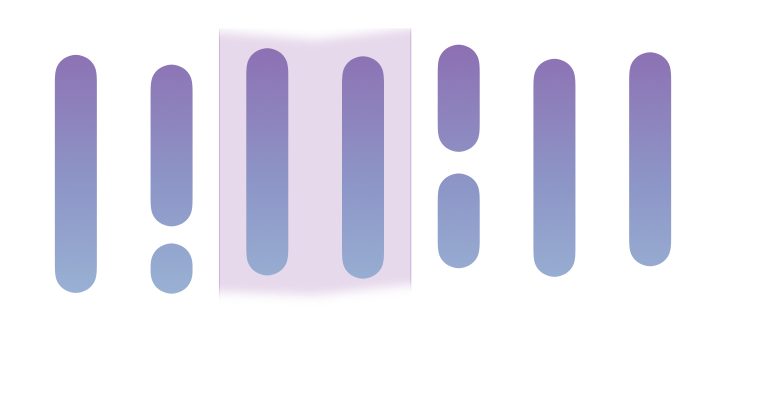
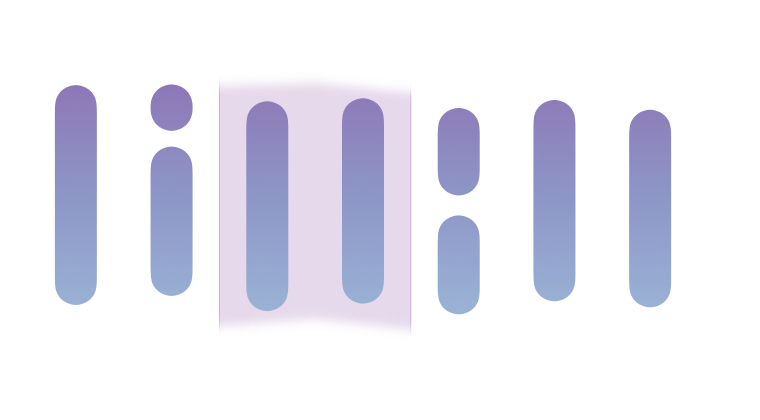
For this schedule-like arrangement, placing earlier times at the top and later times at the bottom follows the progression of each night more naturally. We can reverse the vertical scale while retaining its automatic domain:
Chart {
    // ... sleep interval marks ...
}
.chartYScale(
    domain: .automatic(reversed: true),
    range: .plotDimension(startPadding: 12, endPadding: 12)
)
The reversed argument changes the direction of the inferred y-axis domain without requiring us to calculate its bounds. The startPadding and endPadding values keep the earliest and latest endpoints away from the edges of the plot area.

# Calendar grids
A calendar grid applies the same reference-period technique to individual dates. It arranges each observation by two components of the same date: its week within the calendar sequence and its weekday within that week. Aligning matching weekdays in columns while preserving the sequence of weeks in rows makes daily observations comparable across both dimensions.
We can create this arrangement by plotting the original date vertically by week and a normalized weekday horizontally:
let normalizedWeekday = dataPoint.date.normalizedToReferenceWeek(in: calendar)

RectangleMark(
    x: .value(
        "Day of week", normalizedWeekday,
        unit: .weekday, calendar: calendar
    ),
    y: .value(
        "Week of year", dataPoint.date,
        unit: .weekOfYear, calendar: calendar
    )
)
.foregroundStyle(by: .value("Value", dataPoint.value))
The original date supplies the vertical week position. Its normalized counterpart supplies the horizontal weekday position, while foreground style maps the observation's value to color.
The normalized date retains the weekday and time components while replacing the original week with a shared reference week:
extension Date {
    func normalizedToReferenceWeek(in calendar: Calendar) -> Date {
        let referenceDate = Date(timeIntervalSinceReferenceDate: 0)

        var components = calendar.dateComponents(
            [.yearForWeekOfYear, .weekOfYear],
            from: referenceDate
        )

        let recurringComponents = calendar.dateComponents(
            [.weekday, .hour, .minute, .second],
            from: self
        )

        components.weekday = recurringComponents.weekday
        components.hour = recurringComponents.hour
        components.minute = recurringComponents.minute
        components.second = recurringComponents.second

        return calendar.date(from: components)!
    }
}
Every occurrence of the same weekday now belongs to the same horizontal calendar period. Passing the same Calendar to the normalization and plotting operations keeps the weekday and week-of-year relationships consistent with the calendar used by the chart.
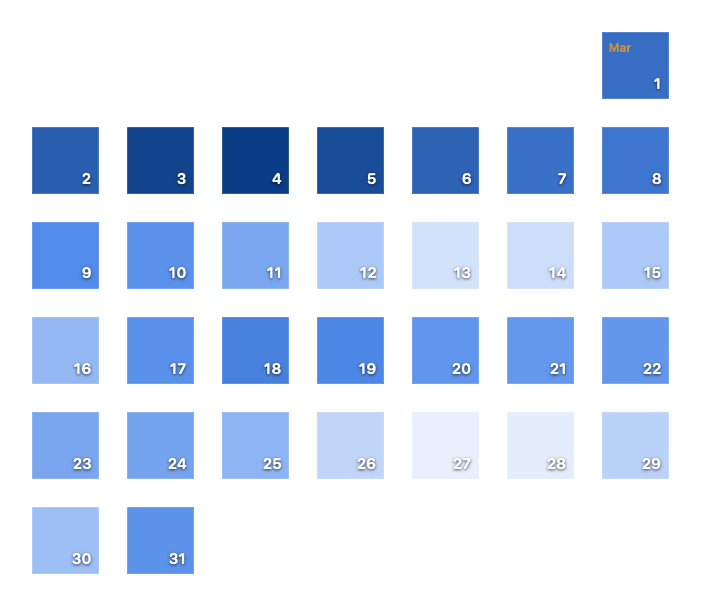
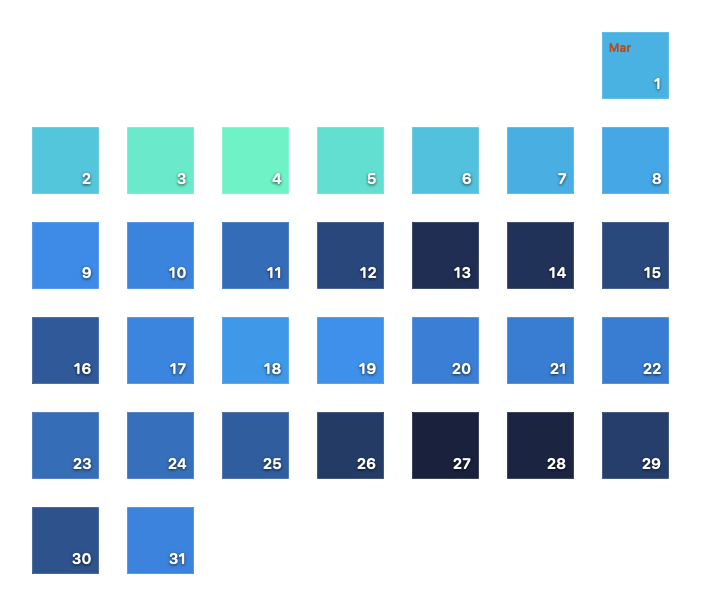
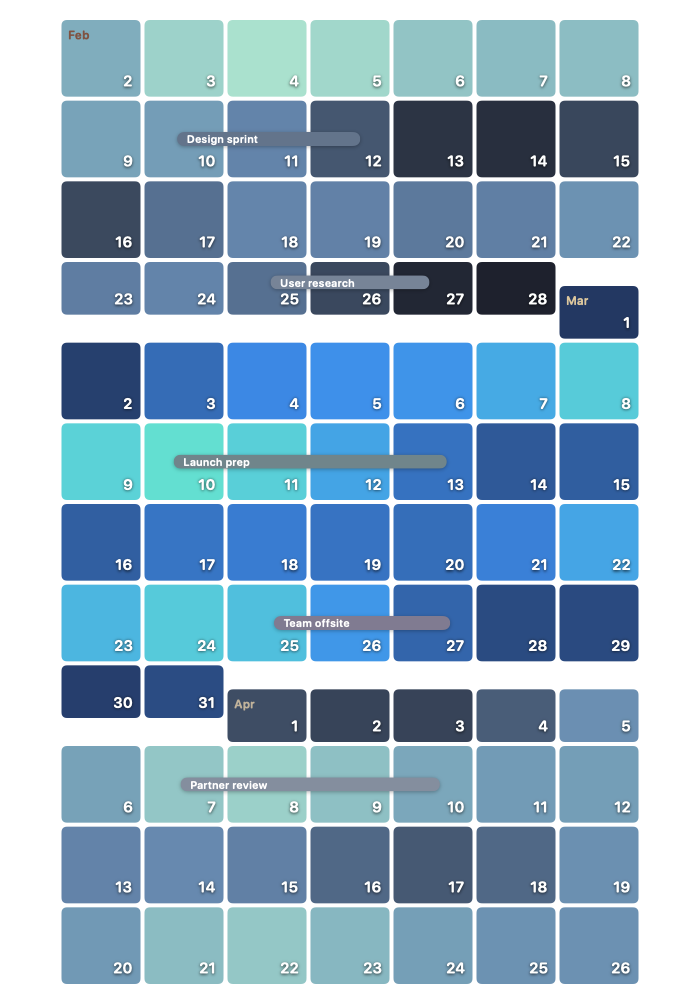
Rendering one month of daily observations produces the basic grid.
# Month boundaries
A RectangleMark centered on unit-based temporal values uses automatic dimensions that leave space between neighboring marks. We can instead derive its width and height from the complete weekday and week periods, then reduce those dimensions by fixed screen-space insets.
A week that contains the end of one month and the beginning of another requires additional separation. Assuming each data point records whether its date belongs to the first or last week of its month, a larger vertical inset and opposite offsets separate the two parts of the shared week:
let normalizedWeekday = dataPoint.date.normalizedToReferenceWeek(in: calendar)
let isMonthBoundary = dataPoint.isInFirstWeekOfMonth
    || dataPoint.isInLastWeekOfMonth

let heightInset: CGFloat = isMonthBoundary ? 14 : 2
let verticalOffset: CGFloat = dataPoint.isInFirstWeekOfMonth
    ? 12
    : dataPoint.isInLastWeekOfMonth ? -12 : 0

RectangleMark(
    x: .value(
        "Day of week", normalizedWeekday,
        unit: .weekday, calendar: calendar
    ),
    y: .value(
        "Week of year", dataPoint.date,
        unit: .weekOfYear, calendar: calendar
    ),
    width: .inset(2),
    height: .inset(heightInset)
)
.foregroundStyle(by: .value("Value", dataPoint.value))
.offset(y: verticalOffset)
Most cells use a two-point inset along both dimensions. Cells in a month-boundary week use a larger height inset, while the offset moves dates from the ending month upward and dates from the beginning month downward. Together, these adjustments create a visible division between the months that share the same week row.
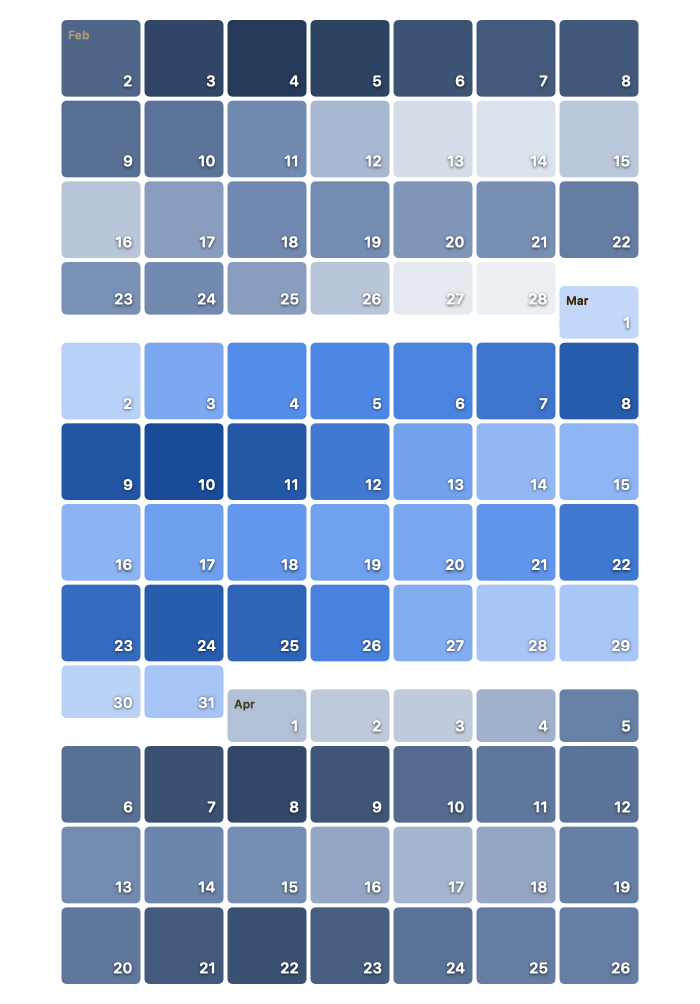
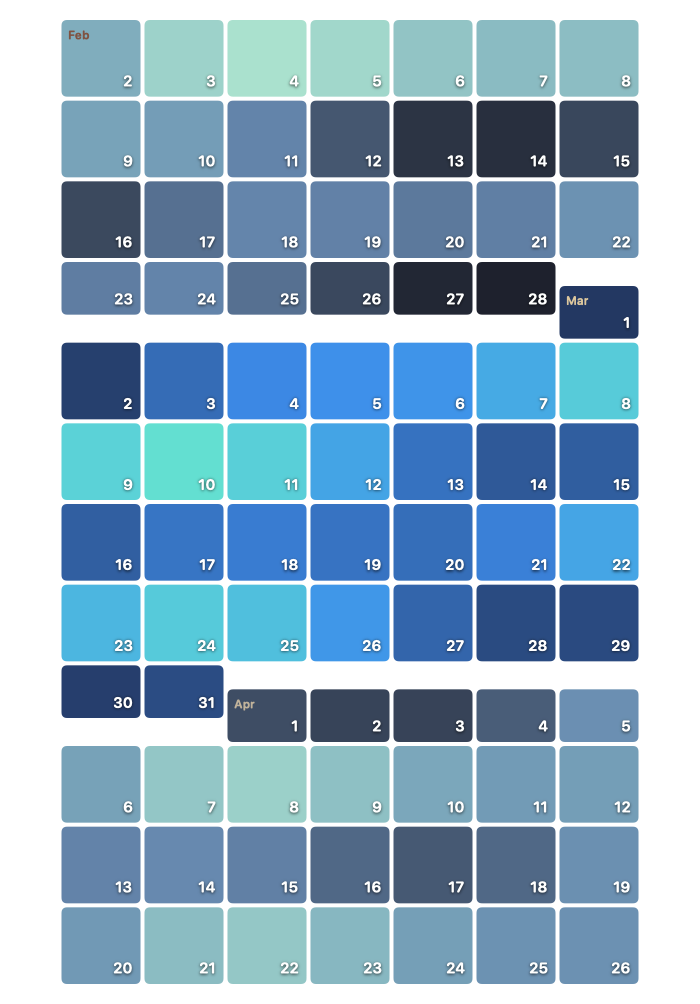
The insets and offsets alter the marks in screen space without replacing their plotted dates. Accessibility navigation can therefore continue to follow the chart's weekday and week-of-year axes.
# Multi-day events
The normalized weekday scale can also position intervals within a week. For an event whose start and end belong to the same calendar week, we provide its normalized endpoints to a horizontal BarMark and use the original start date to select the vertical week:
let normalizedStart = event.startTime.normalizedToReferenceWeek(in: calendar)
let normalizedEnd = event.endTime.normalizedToReferenceWeek(in: calendar)

BarMark(
    xStart: .value("From", normalizedStart),
    xEnd: .value("Until", normalizedEnd),
    y: .value(
        "Week of year", event.startTime,
        unit: .weekOfYear, calendar: calendar
    ),
    height: .fixed(14)
)
.accessibilityLabel(
    Text("\(event.title), starting \(event.startTime, format: startDayFormat)")
)
.accessibilityValue(
    Text("Duration: \(event.eventDuration, format: durationFormat)")
)
The bar begins and ends at the appropriate weekday and time within the reference week. Its vertical value places it in the week in which the event occurs. Because the event bars and calendar cells use the same normalized weekday scale, their positions align directly.
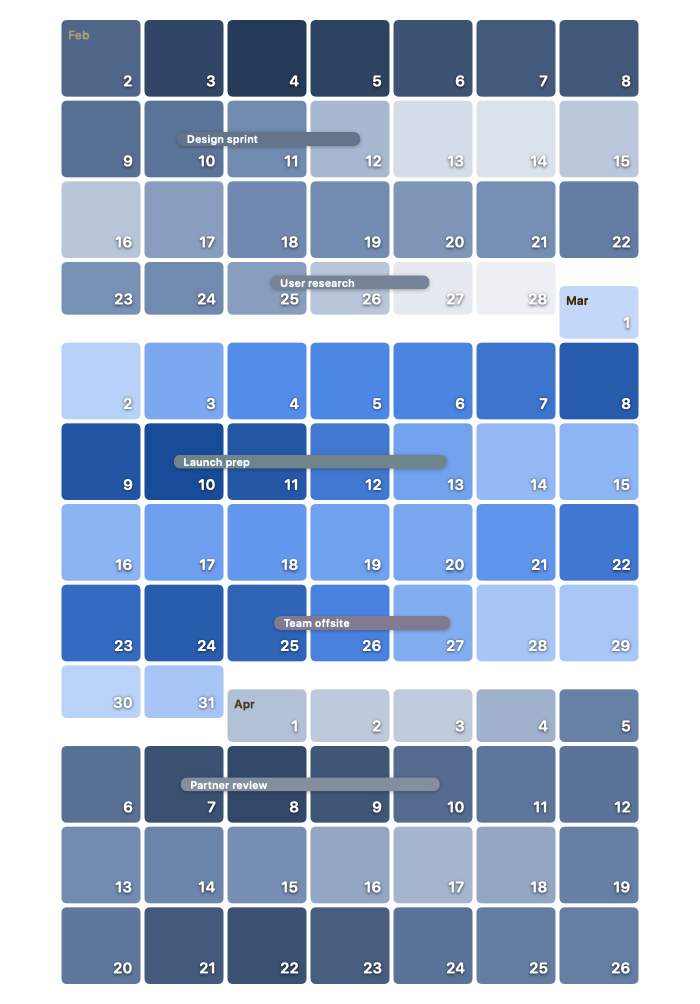
The custom accessibility label and value retain the event's original start date and duration instead of exposing the reference week used for layout. An event that crosses a calendar-week boundary cannot remain within one week row, so it needs to be divided into separate intervals before being placed in the grid.