Swift Charts Beyond the Basics
A practical reference for building advanced data visualizations with the Swift Charts framework
- Turn complex datasets into charts that make important comparisons, patterns, and relationships clear
- Go beyond basic marks and default styling with multi-metric visualizations, calendar layouts, heat maps, layered rendering, and custom interactions
- Develop a practical mental model of how Swift Charts represents, scales, arranges, and renders data, so you can confidently solve new visualization requirements
- Keep selection, scrolling, and animation responsive by placing frequently changing state at the right update boundary
- Preserve original values and units, and keep accessibility descriptions accurate, as charts transform between scales, viewports, and levels of detail
Want to try reading a sample for free? You can download the free sample bundle or read the sample chapter online.
You can also check out the table of contents to get an idea of what's inside.
What is included
- Online book access
- EPUB and PDF downloads
- Free lifetime updates
What it covers
- Preparing time-series, categorical, proportional, distributional, spatial, and multivariable data for visualization
- Composing charts with marks, vectorized plots, custom ChartContent types, and Plot groups
- Choosing geometric representations and controlling how series identity and collection order form connected content
- Working with plottable values, temporal intervals, custom Plottable types, multiple metrics, derived values, and missing data
- Arranging content through categorical grouping, stacking, calendar layouts, and heat-map grids
- Defining scale domains and ranges while preserving the meaning and units of source values
- Managing chart layers, drawing order, compositing boundaries, blend modes, masks, and shape clipping
- Using color, gradients, patterns, symbols, strokes, legends, and spatial separation to encode data and establish visual hierarchy
- Adapting chart styling and semantic representations to accessibility settings without duplicating accessible content
- Scoping state dependencies across ChartContent, chart configuration, and mounted SwiftUI presentation layers
- Resolving positional and range selections, creating interactive legends, and replacing native chart gestures
- Building scrollable charts and coordinating complete domains, visible spans, viewport positions, scroll phases, and resting behavior
- Animating plotted values, viewports, scale domains, and transitions between levels of detail
What you can build
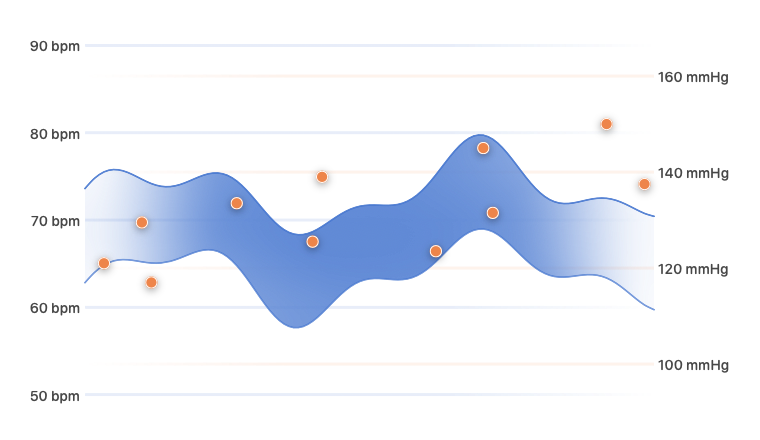
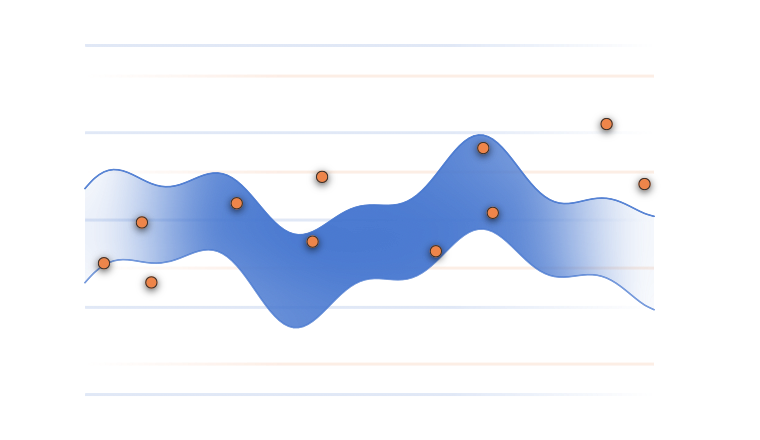
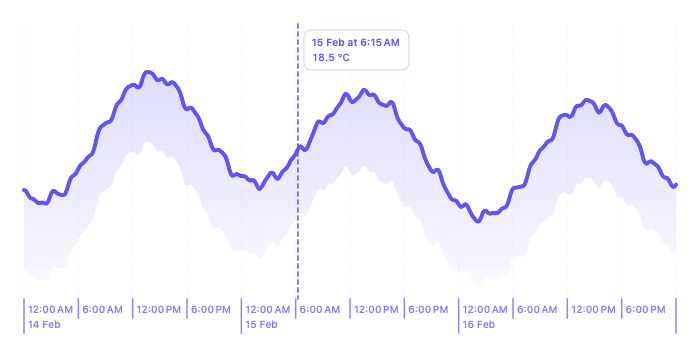
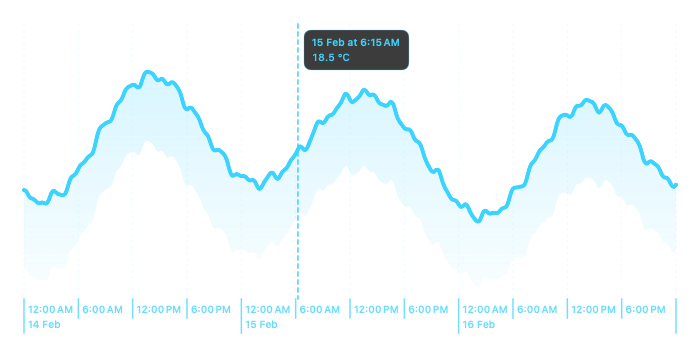
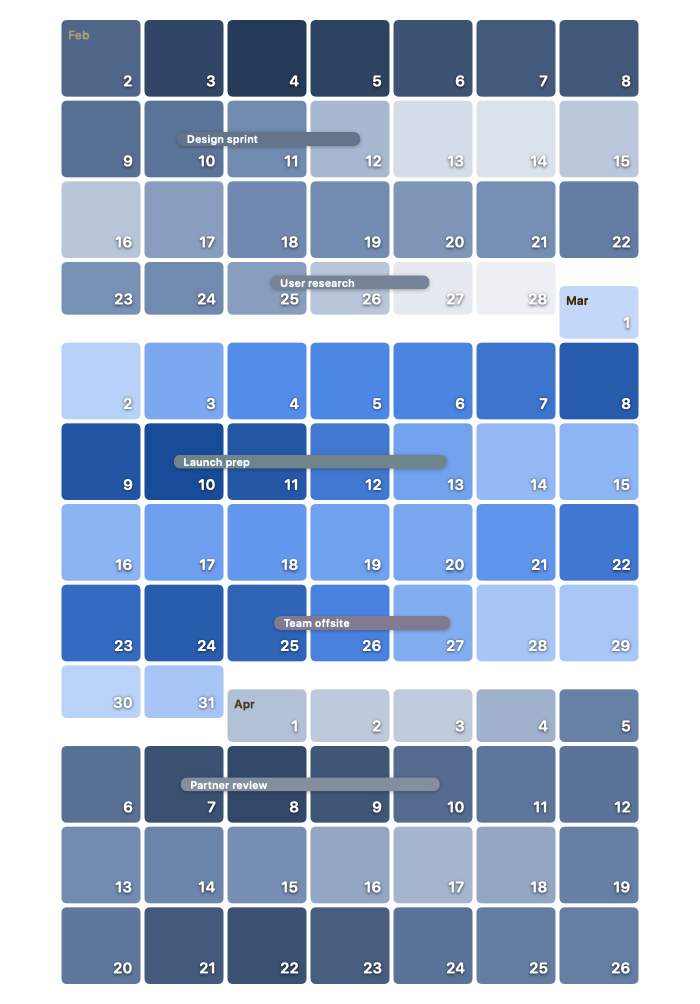
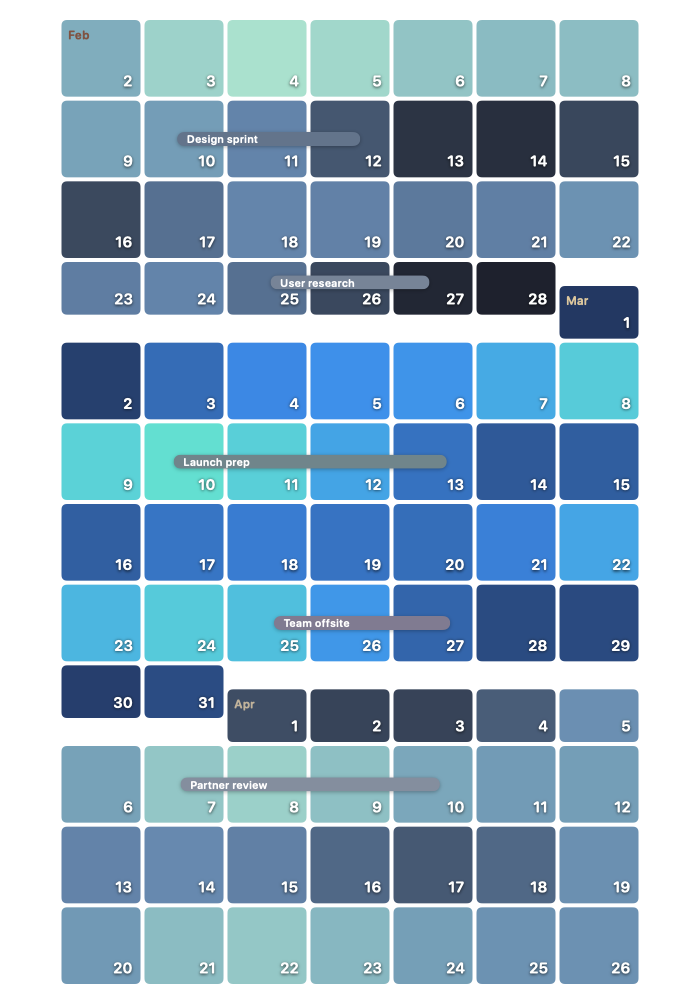
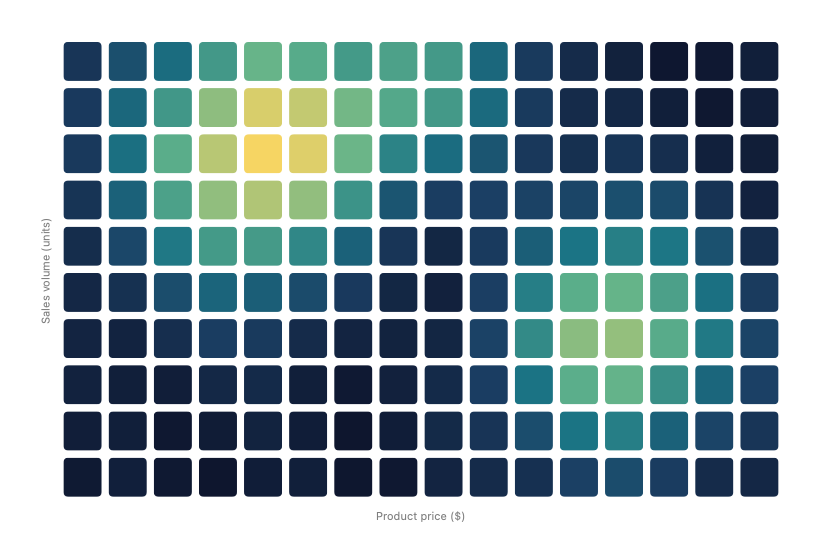
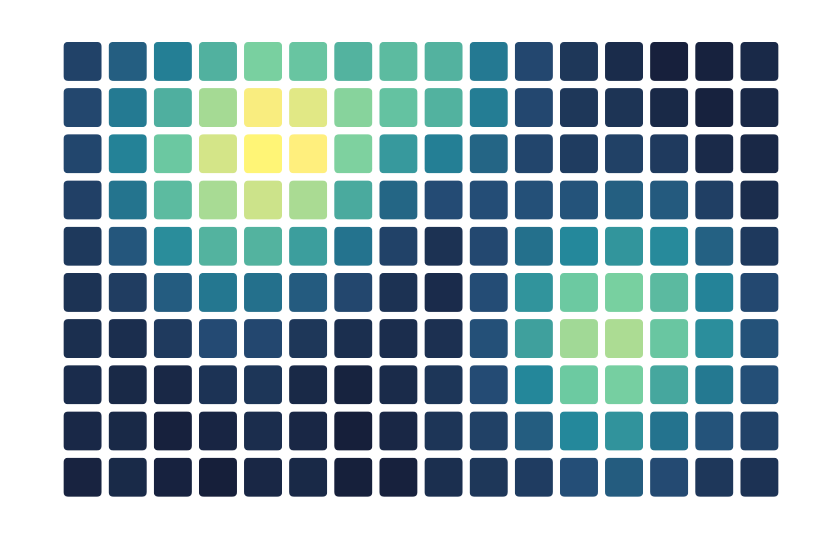
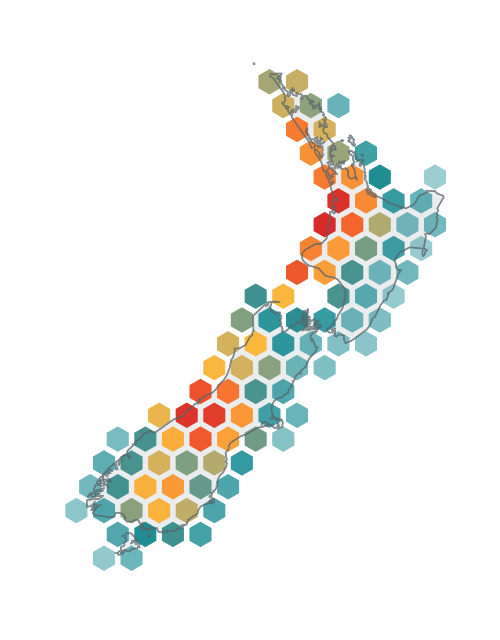
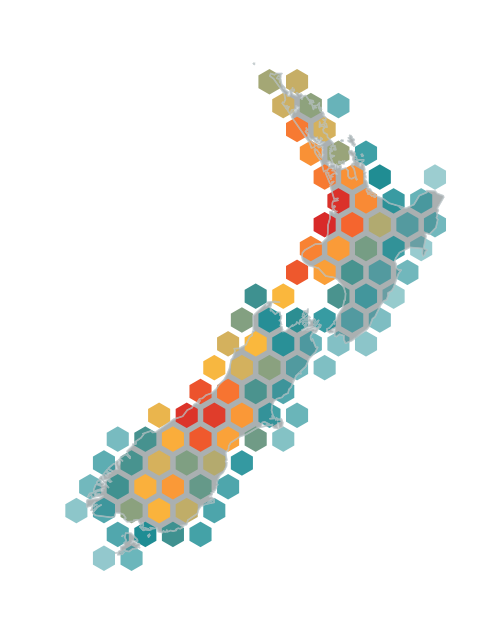
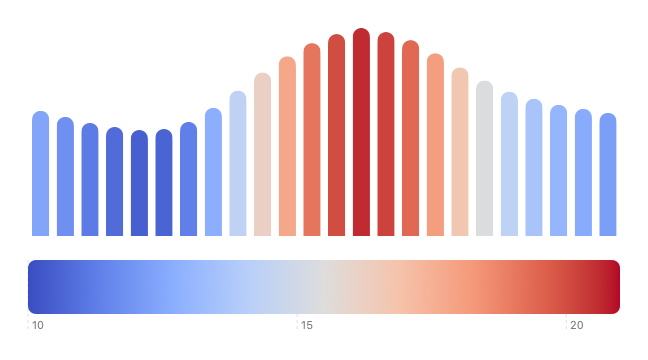
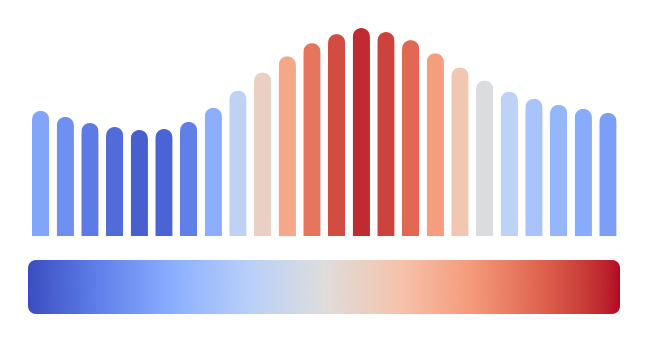
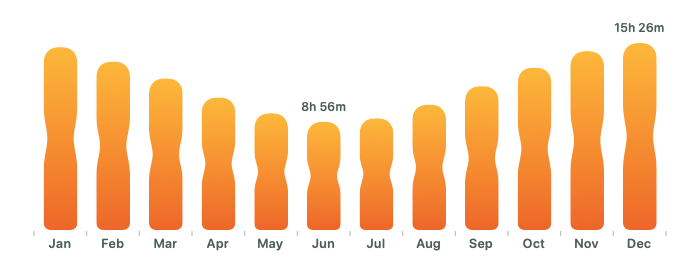
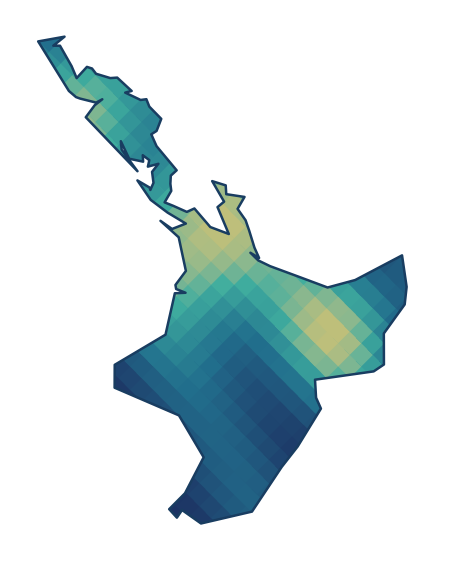
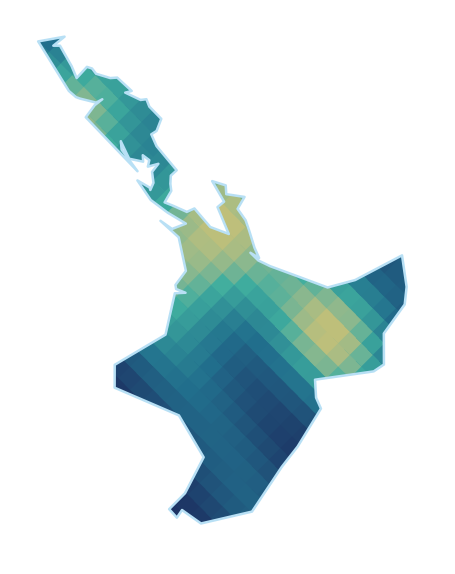
Move beyond default marks and styling to create charts that reveal complex comparisons, spatial patterns, time-based structures, and relationships clearly. The book explains the Swift Charts mechanisms behind each result, so you can apply the same control to your own data and interfaces.


Who the book is for
Swift Charts Beyond the Basics is written for developers who already know Swift and SwiftUI, can build a basic chart, and want to create more capable data visualizations with the Swift Charts framework. It is especially relevant when a chart needs carefully prepared data, custom composition and rendering, responsive interaction with large or frequently changing datasets, or coordinated transitions between presentations. The book explains the framework mechanisms behind these decisions so that you can apply them to the requirements of your own data and interfaces.
About the authors


Natalia has many years of experience building user interfaces for Apple platforms in startups and large companies. Before founding Nil Coalescing, she worked on UI frameworks at Apple as a member of the core SwiftUI team. She shares her knowledge of Swift, SwiftUI, and Apple platform development through articles, talks, and books.


Matthaus began his engineering career in data science before moving into backend and app development. He has since spent many years working with Swift, including extensive freelance and consulting work with Swift Charts for applications built around large and complex datasets.
Full table of contents
Have questions about the book? Send us a message.