This subchapter is provided as a free sample for Swift Charts Beyond the Basics book.
You can read it online or download the sample bundle with PDF and EPUB by clicking the link below.
Download free sampleTo get access to the contents of the whole book you need to purchase a copy.
FREE SAMPLE - online version
Stacking
Stacking combines several bar or area values along a measured axis so that every value contributes to a shared extent. Unlike positional grouping, which assigns subcategories separate positions within a band, stacking keeps related values at the same position and accumulates them along the other axis.
Bars and areas express this cumulative relationship in different ways. Bars accumulate discrete values that occupy the same position, while area stacks accumulate connected series across a sequence of shared positions.
# Stacking methods
MarkStackingMethod provides four ways to relate these values: unstacked, standard, normalized, and center. Swift Charts uses standard by default when a bar or area supplies one value along the stacking axis. We can select another method through the stacking parameter in both mark and vectorized plot declarations. In a vectorized plot, the selected method applies to the complete collection and cannot vary between its elements.
This area chart selects center stacking for power-draw readings from several devices:
ForEach(readings) { reading in
    AreaMark(
        x: .value("Time", reading.timestamp),
        y: .value("Power draw", reading.powerDraw),
        series: .value("Device", reading.device),
        stacking: .center
    )
    .foregroundStyle(
        by: .value("Device", reading.device)
    )
}
The series value determines which readings form each connected area. The stacking method then controls how those areas share the vertical extent at every timestamp, while foreground style keeps the device series visually distinguishable.
Applying the same source values with each method shows how stacking changes both area and bar content:
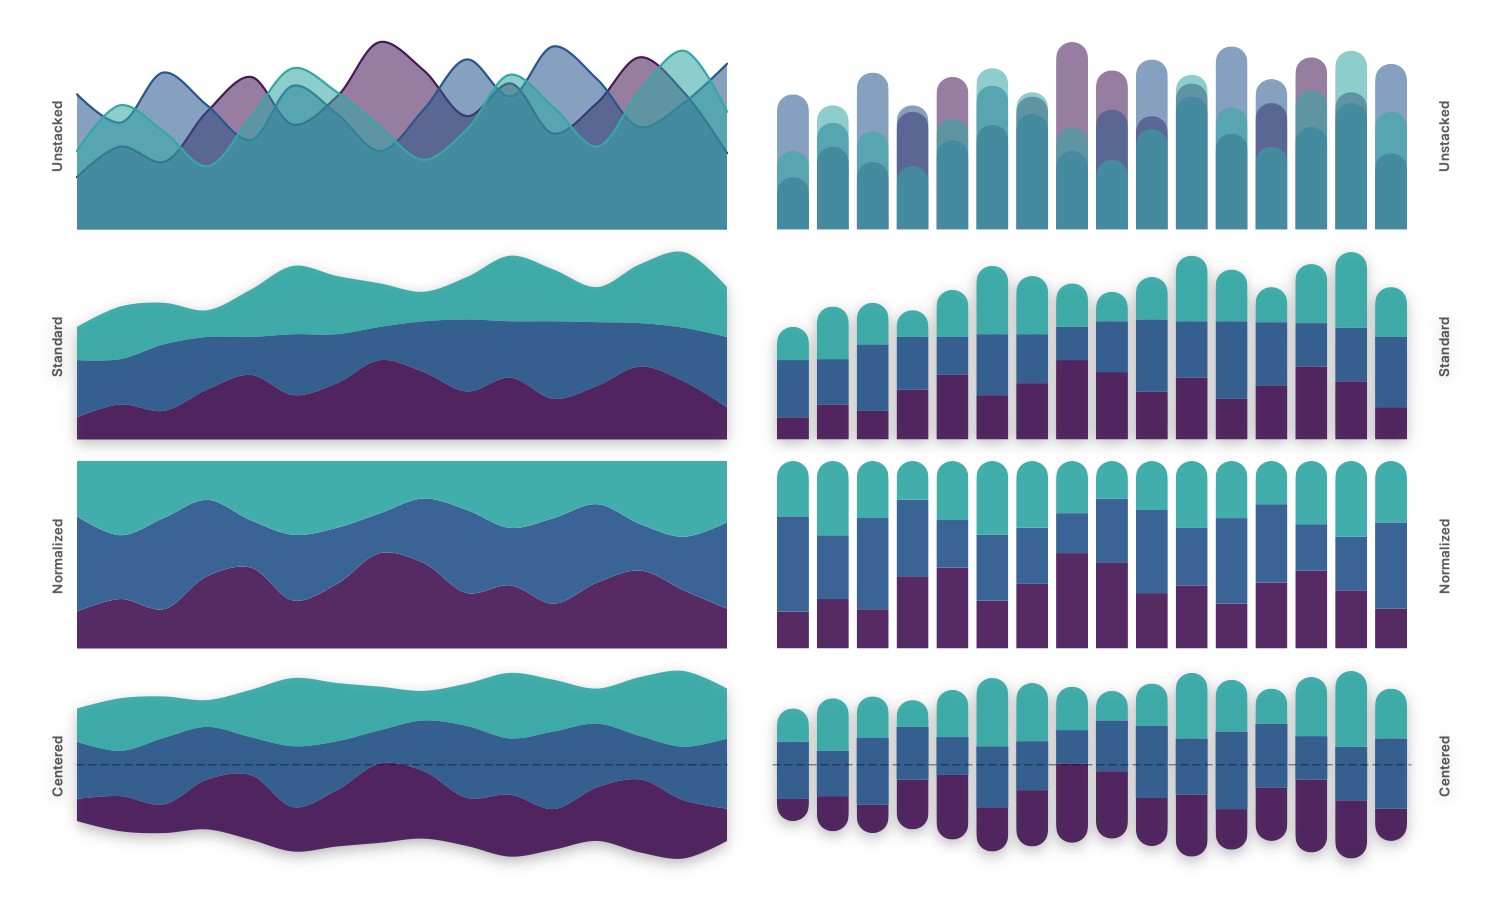
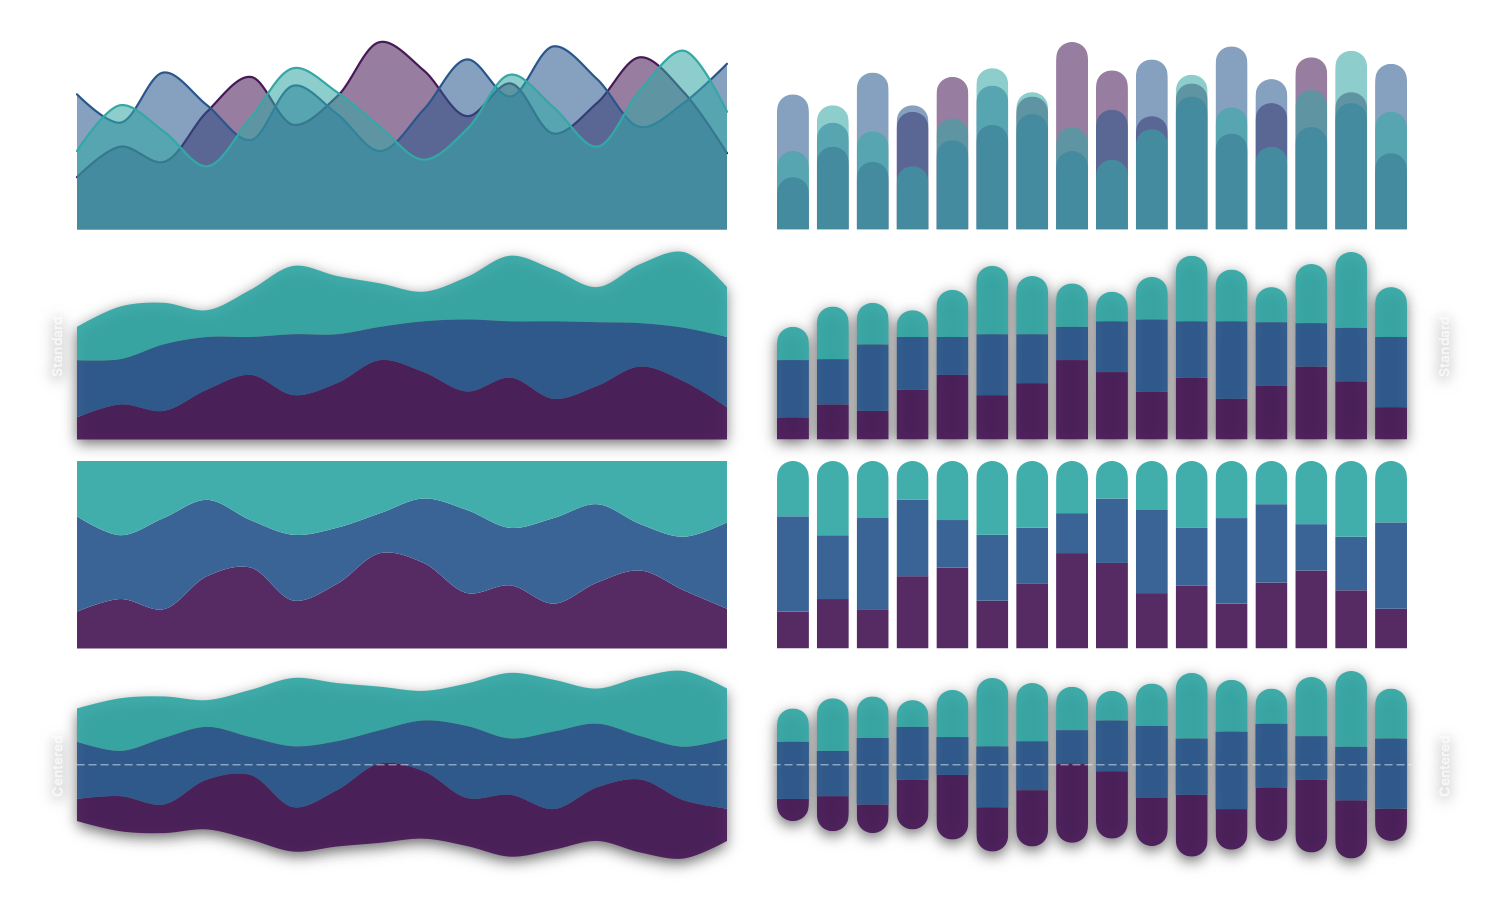
With unstacked, each area or bar retains its own zero baseline, so values that share a position overlap. standard instead builds a cumulative extent by placing each segment after the preceding one. This preserves the original magnitudes while making the outer boundary represent their total.
When relative contribution matters more than total magnitude, normalized converts the values at each position into shares of their total. Every complete stack then has a consistent extent, allowing changes in proportion to remain distinct from changes in the overall amount. The center method also preserves the original magnitudes, but offsets the cumulative extent around a centered baseline, creating a streamgraph when used with areas.
An area stack requires every series to provide a value at each shared position. Without corresponding values, Swift Charts cannot construct the complete cumulative extent at that position.
# Chart-wide area stacks
A Plot groups chart content structurally, but it does not establish the boundaries of an area stack. Swift Charts resolves area stacking across the surrounding Chart, so area series in separate Plot containers can still contribute to the same cumulative extent.
This distinction matters when separate Plot groups use the same stacking method. Consider one collection of power readings grouped by component and another grouped by sensor:
Plot {
    AreaPlot(
        componentPowerReadings,
        x: .value("Time", \.time),
        y: .value("Power draw", \.powerDraw),
        series: .value("Component", \.component),
        stacking: .standard
    )
}

Plot {
    AreaPlot(
        fanPowerReadings,
        x: .value("Time", \.time),
        y: .value("Power draw", \.powerDraw),
        series: .value("Sensor", \.sensor),
        stacking: .standard
    )
}
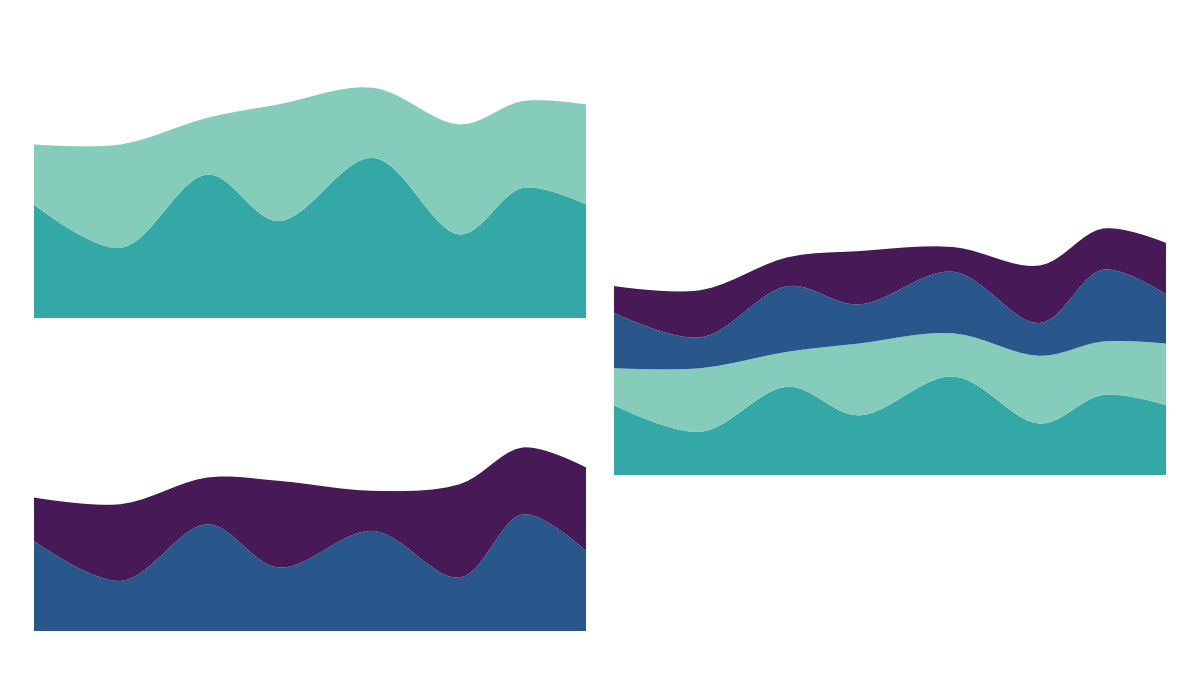
Placing each Plot in its own Chart creates two independent two-series stacks. Placing both in one Chart combines all four series into a single stack:
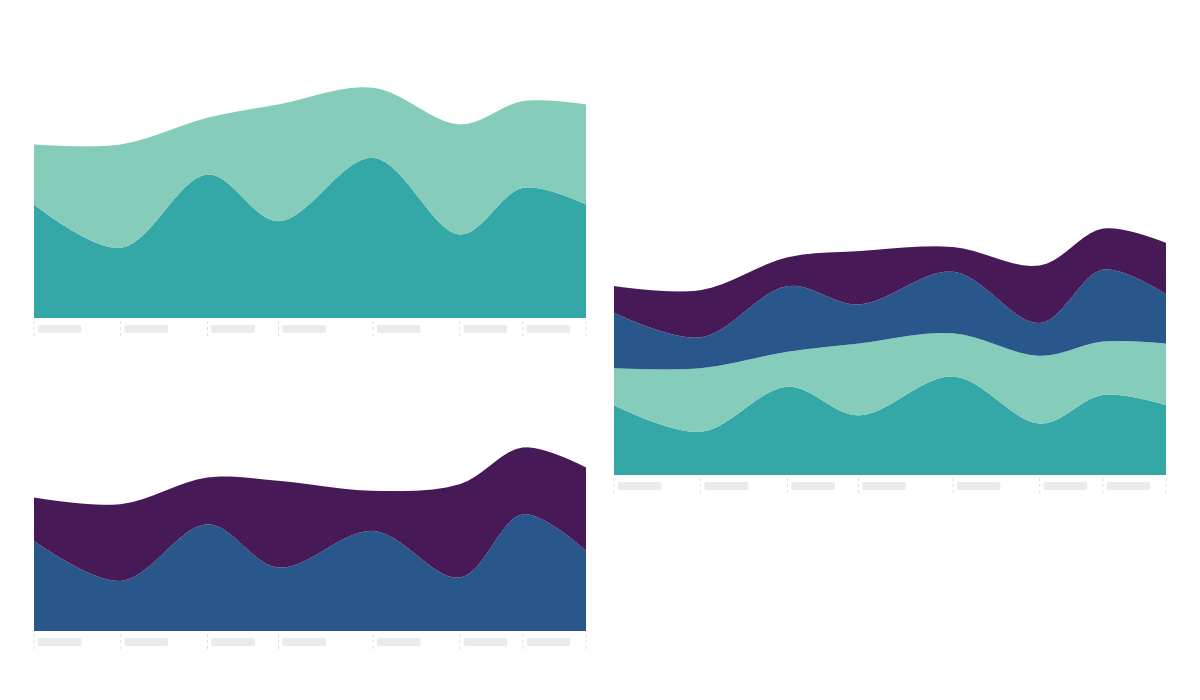
Loops, nested chart content, and custom ChartContent types behave the same way: they can organize a composition, but they do not establish stacking boundaries. The order within the combined stack follows the order in which each series first appears in the composition.
# Grouped bar stacks
Positional grouping and stacking can describe two levels of categorical structure within the same bar chart. position(by:axis:) divides a primary band into subgroup positions, and bars at each resulting position form their own stack.
Suppose a power-draw dataset records the contribution of several usage types during the day and night for each residence:
BarMark(
    x: .value("Residence", reading.residence),
    y: .value("Power draw", reading.powerDraw),
    stacking: .standard
)
.foregroundStyle(
    by: .value("Usage type", reading.usageType)
)
.position(
    by: .value("Day or night", reading.dayOrNight),
    axis: .horizontal
)
The chart gives every residence separate daytime and nighttime bars. The height of each bar represents its total power draw, while the colored segments show how much each usage type contributes to that total.
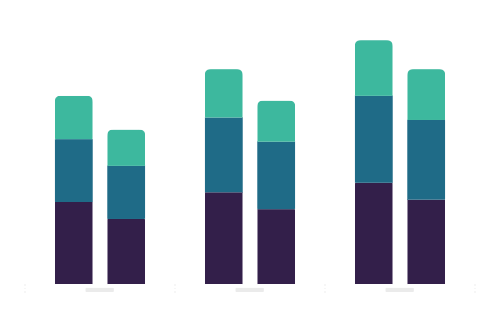
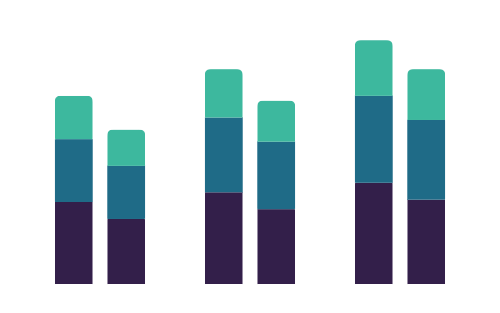
The residence value establishes the primary horizontal bands, and dayOrNight selects one of two positions within each band. At every resulting position, standard stacking accumulates the powerDraw values, while foreground style identifies the usage type represented by each segment.
Applying positional grouping to area content does not create the same independent stacking boundaries. Area series continue to participate in the chart-wide stack determined by their stacking method.
# Independent area stacks
When several area groups need separate baselines within the same coordinate space, their chart-wide stacking behavior means that automatic stacking cannot produce the required arrangement. We instead need to calculate the cumulative lower and upper bounds of every area ourselves.
Assuming group is nonempty and each series stores one reading for every shared position in the same order, the following calculation processes the group in the intended series order:
var stackedReadings: [StackedReading] = []

for position in group[0].readings.indices {
    var cumulativeValue = 0.0

    for series in group {
        let reading = series.readings[position]
        let stackStart = cumulativeValue
        cumulativeValue += reading.value

        stackedReadings.append(
            StackedReading(
                time: reading.time,
                name: series.name,
                value: reading.value,
                stackStart: stackStart,
                stackEnd: cumulativeValue
            )
        )
    }
}
The outer loop uses the readings of the first series to visit every shared position. At each position, the inner loop follows the chosen series order and advances cumulativeValue. Every resulting StackedReading retains the original value as well as the cumulative stackStart and stackEnd used to position its area.
After applying the same calculation to both groups, we pass their explicit bounds to separate AreaPlot declarations:
AreaPlot(
    stackedReadings,
    x: .value("Time", \.time),
    yStart: .value("Lower power bound", \.stackStart),
    yEnd: .value("Upper power bound", \.stackEnd),
    series: .value("Residence", \.name)
)
.accessibilityLabel(\.accessibilityLabel)
.accessibilityValue(\.accessibilityValue)
.offset(y: -ridgeOffset)

AreaPlot(
    otherStackedReadings,
    x: .value("Time", \.time),
    yStart: .value("Lower power bound", \.stackStart),
    yEnd: .value("Upper power bound", \.stackEnd),
    series: .value("Residence", \.name)
)
.accessibilityLabel(\.accessibilityLabel)
.accessibilityValue(\.accessibilityValue)
Because yStart and yEnd describe the area bounds directly, the two plots no longer participate in automatic stacking. Applying offset(y:) to the first group moves it upward, allowing the independent stacks to overlap as separate ridges.
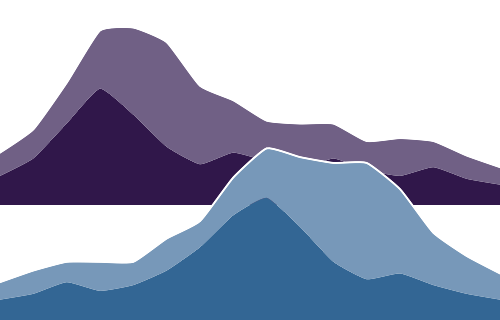
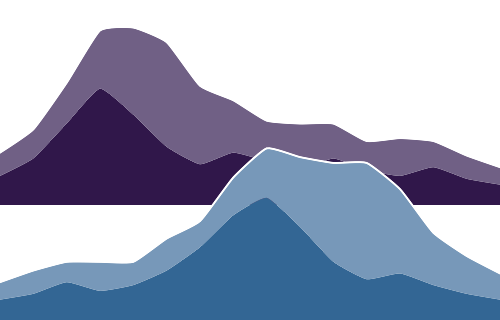
The custom accessibility values should describe the original power-draw measurements rather than the cumulative bounds used to arrange them. Those bounds are derived layout values and do not replace the meaning of the observations.
Automatic stacking is appropriate when bars or area series should participate in one shared cumulative relationship. Explicit bounds give us control when separate area groups need independent cumulative extents within the same chart, but they also make the application responsible for their alignment, order, and accessible descriptions.